
RFM Model In Action - How To Drive Cinema Audiences Back To The Big Screen
Recency Frequency Monetary (RFM) modelling is a proven marketing model for behaviour-based customer segmentation. By helping marketers analyse and action their customers’ behaviour, it drives the strategy that sits behind their campaigns. But how does a cinema circuit apply the RFM model post Covid closures ?
In October 2021 Showtime launched our new Customer Analytics product at the UKCA Conference in London. We presented a case study of how we applied the Recency Frequency Monetary model to Irish cinema chain Movies@ to help them bring audiences back to their cinemas for Bond’s No Time To Die. Below we take a deep dive into what this RFM strategy looks like, how it helps to overcome the customer churn challenge post-closures, and what action points you can take to rebuild your audience numbers.
What is RFM Modelling?

Why Did We Create The RFM Dashboard ?

Deirdre Moran, Product Manager:
“We have been providing analytics solutions to our customers since Showtime began in 2015. First we developed Showtime Insights to enable a simple view of operational data. We then went on to build Showtime Engage, our marketing solution which provides a view of customer attributes and an engine to segment and communicate with them. What we learned as time went on and people became more advanced in their marketing was that many of our customers had a shared frustration: They had no single view of their base.There was just no way to look at a customer base and understand behaviours around who is visiting more or less, who we are losing and who we are gaining, so that’s how the RFM Dashboard came about. We wanted to create a simple way they could analyse their entire customer base dynamically in real time.”
How Does A Cinema Circuit Apply The RFM Model Post-Covid Closures?

Mark de Quervain, Director Client Services & Strategy:
“Understanding the numbers behind a cinema circuit’s customer base is crucial to how the marketing strategy should be designed. Only by establishing what is currently happening in the customer base, and what has historically happened in that base, can we determine what needs to happen in the future - to at worst claw back to the numbers we had in 2019, but to ultimately lead to an uplift in that business. “
In order for a cinema chain to rebuild their customer base in terms of number of people required, we first need to identify the base we are working with.
New Customers (first time ever to database)
Returning Customers (back since re-opening or active in 2019)
‘Back From The Dead’ Customers (those who have returned after 36 months)
Lapsing - ‘At risk’ customers (not active in the last 24-36 months)
These are definitive numbers, regardless of how much they’ve spent or how often they’ve come. Then, we take a view of these same categories in 2019. This then gives us our variance and as such our recovery goal.
However, there is one major factor we need to account for as a result of closures during Covid - increased customer churn.
The Customer Churn Challenge
The changing lifestyle of consumers has caused shifts in behaviour and traditional trends. Take away food has continued in its increasing popularity even in the wake of the pandemic, and the restaurant boom has slowed. Work patterns have changed so less people are leaving their homes, shopping centres - many of which are home to multiplex theatres - are experiencing footfall challenges, and with a surge in the number of people moving home or moving out of cities the traditional ‘loyal’ customer base is now changing. Add all of this to the lingering fear of Covid and it results in a major shift in the make-up and behaviour of your customer base.
In any business there is customer churn, and it is critical to understand and track it. If new customers typically account for 25% to 40% of your customer base, exhibitors are now faced with the additional task of making up for the lost time during closures where no new business was generated, and compensate not only for the organic number of lost customers, but also for the additional churn associated with the challenges of the pandemic.
We cannot assume that we can go back to the way of doing things pre-Covid and see the same results from our marketing efforts. We are dealing with a different picture of the market overall, of customer bases within circuits, right down to customer bases within individual cinemas, and we can no longer rely solely on our Loyalty programme data as a navigation. As a result we need to break it down to the different cohorts of individuals.
By having a view of this data we can start to understand metrics like how many new customers we need a month, how many we lose, what our customer churn was pre-Covid, what it is now and how effective our loyalty program is.
By getting a monetary value associated with each customer we then have visibility of who our most valuable customers are - making sure we are taking the appropriate action to either retain them, or bring them back if they are in danger of lapsing or have already lapsed.

Deirdre Moran, Product Manager
“As data specialists we would have been asked to perform Loyalty analysis and customer profile analysis for clients as project work, to help them with redesigning their Loyalty Programs. It’s always been very manual for them to be able to do this - there were no tools available to perform this analysis easily, so understanding who is at what level of the program, who should be moving up a tier etc was all very difficult.
Then you have not just your Loyalty customers but also your Marketable customers - traditionally those who signed up to a newsletter - but these were the only alternative to Loyalty customers and they still didn’t know anything about them as a base in terms of who is spending what, whether it’s going up or down, who is falling into different demographics over time etc.
As part of our new offering we will record each customer's movement in the RFM dashboard to see how the model is changing over time, so you can see how customers move and whether their recency & frequency scores improve or worsen. This then allows you to gauge how your strategies are working or how you might need to change how you target customers.”
RFM In Action At Movies@
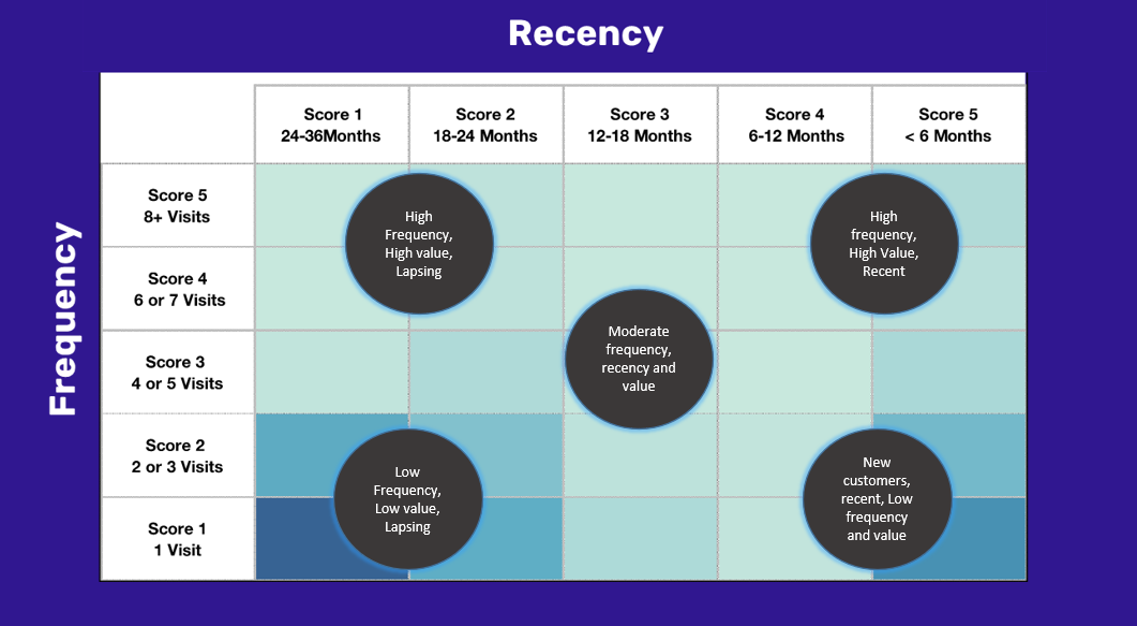
The first step in building an RFM model is to assign Recency, Frequency and Monetary values to each customer. Our RFM analysis numerically ranks a customer in each of these three categories, on a scale of 1 to 5 (the higher the number, the better the result). The "best" customer would receive a top score in every category, so our ‘Champion Customers’ are those in the top right hand corner, with 8 or more visits over the last 6 months. We took a 3 year view of these values and put it on a Heat map, making it filterable by customer attributes and location attributes.
The 36month RFM to end of 2019 gave us the following Key Observations:

Pre-Covid Baseline Performance
What % of customers came in last 6 months of 2019 and what % of all visits over 3 years this accounted for (high)
What % of the base are new customers gained in the 12 months across 2019
A higher proportion of annual revenue was concentrated in the last 6 months of 2019
What % of low recency, low frequency customers are in danger of lapsing
What % of all customers are low frequency guests who haven’t been seen in 18 months and therefore in danger of lapsing
What % of the base the most frequent and loyal customers make up, and what the value attached to each of them is
We identified who the most loyal customers were who were in danger of lapsing:
While the % is low, the value associated with these individuals means we cannot afford to lose these types of customers, and must design and implement a strategy to retain them.
Conclusions:
This is a business reliant on recency, with a significant number of low frequency customers. That means, we know exactly what % of new and ‘back from dead’ customers we need to maintain the base.
Not all high value customers are loyalty members

ACTION:
Drive more new customers, reactivate all existing and pay attention to those who have lapsed or are lapsing with a different campaign.
Implementing The Strategy Using Bond No Time To Die
The next step we took was to perform an RFM analysis of 2021 Pre Bond’s No Time To Die (up to end of August 2021).
We saw:
What % of the base have visited since re-opening
What % of all customers since reopening are NEW, which was more than double that of 2019, indicating a shift in the customer base
People been in past 12-18months (sporadic opening) made up only a small % of the base - these are the ones likely to return first so we need to prioritise targeting them with very specific messaging
What % of the base are in danger of lapsing, which is nearly double that of 2019
What % of loyal high value customers are in danger of lapsing - 6.6 x times higher than pre-Covid
What % the total customer base was down
Objectives:
Attract new customers not on the database
Reach existing customers (on database but not-marketable)
Get marketable customers back… fast!
How did we do this?
Export these customers into Showtime Engage to create marketable segment and email campaign
Use Engage to create lookalike audiences and export to Social and AdWords to find more and reach those not marketable
Create segments of customers in level below to move them up with value experience offers
The Tactical Efforts
Bond’s No Time To Die provided a big opportunity to kick start and accelerate recovery. We set a target with Movies@ to drive Pre-Sales to a number ahead of the previous 2 Bond movies .
Channels Used For Targeting New Customers:
AdWords and Facebook, audience using lookalike audiences created from Showtime Engage
Landlords: Social, Web, Email
Google My Business
Web: Takeover, sliders, landing pages
Confirmation booking email banners
Local media promotions
Channels Used For Targeting Existing Marketable Customers
Organic Social (Facebook, Instagram ,Twitter)
Emails (Segmented) using Showtime Engage & RFM :
Total marketable database (007 days out)
007 Not booked No Time To Die, have been back since reopening
007 Not booked No Time To Die & have not been back since reopening
Saw Skyfall and Spectre & not yet seen No Time To Die split between been back/not returned (Using RFM)
The Results

Conclusions:
Bond has had major impact on driving positive change, particularly new and recent customers.
Lapsing was significant among non Bond visitors meaning there’s much more action for us to take

ACTION:
Get Bond customers back again. What films did they see at the cinema in the 12 months following Skyfall and Spectre?
Getting Bond Customers Back Again
The next step in our strategy was to look at the Top 10 Summary of films that customers who had seen either of the two previous Bond movies had come to see in the following 12 months. With an eclectic mix of films drawing this subset of customers back, we saw that post Bond behaviour was to visit an average of 3.7 times during that period.
Top 10 Films Seen Post Skyfall


Top 10 Films Seen Post Spectre


Using these movies as our Comp Titles, we matched them to upcoming films and create segmented audience campaigns using Showtime Engage to drive them back. We also exported lookalike audiences from Showtime Engage into the Movies@ social accounts to create targeted ads to reach our non-marketable customers.
Ongoing Marketing Strategy
Taking a film centric approach with pre and post-opening marketing campaigns, the ongoing strategy includes:
Focus on major releases first
Drive new customers
Activate existing customers who have not been to cinema yet
Inspire lapsed/lapsing customers
Develop and nurture high value customers
Optimise loyalty scheme

Deirdre Moran, Product Manager
“Some of the larger global circuits have advanced Loyalty Programmes and had invested in RFM modelling before through a consultant, but it was so manual that by the time the data had been collated and exported back out it was no longer relevant and so no longer usable. This manual analysis meant they weren’t able to react quickly enough to prevent losing customers and had no way to see if their targeting strategies are working.
To counter this, we wanted to create a way that our customers could analyse not just their Loyalty customers, but their entire base, and do it in real time. We can now record each customer’s RFM and other attributes movements on a daily basis - so you can tie in the data to use with your marketing tools and see how your strategies improve your scores.”
Showtime Tools For Success
Customer Analytics: RFM + Suite of other dynamic products
Loyalty: New Diagnostic and Tune Up Kit
Showtime Engage: Segmented and smart campaign creation and management
Showtime Sentiment: Feedback, preferences, profiling, surveys
Showtime Benchmark: Tracking how you are doing in the market
Showtime Marketing as a Service: In-house Engage marketing experts to augment existing strategy
If you would like to learn more about how your circuit can benefit from analysis of your data get in touch with our experts.